Home Prices

Buyers and sellers are seeing a shift in the housing market. From 2021-2022, home sales dropped in the region by 42%. According to the Gardener report, reasons that account for this drop in sales were, higher mortgage rates, an increase in inventory, and buyers anticipating mortgages and prices will fall in 2023.
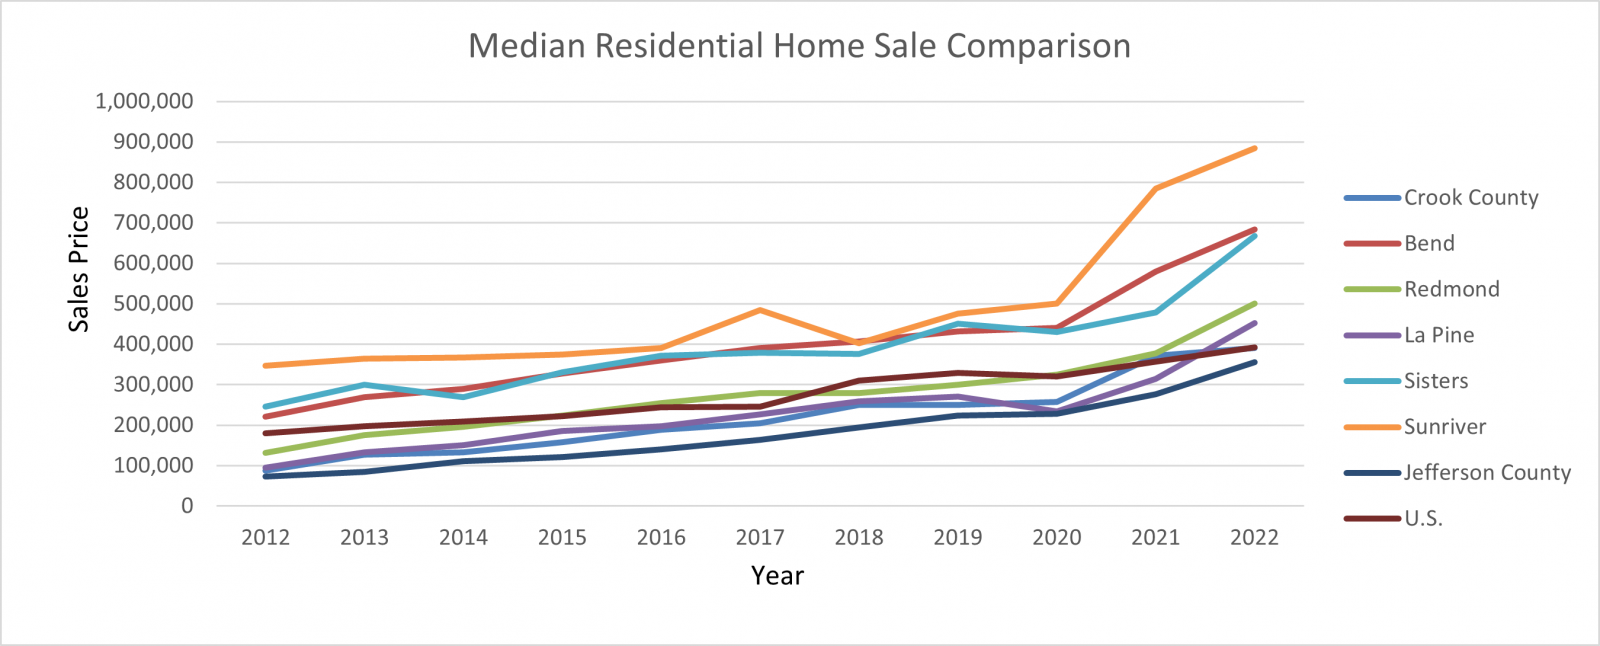
According to the most recent Beacon Report, Redmond's current median home price mid-year of 2022 is $505,000.
| Existing Single Family Home Prices (residential, less than one acre, $) | |||||||||||
| Median Sales Price | |||||||||||
| 2012 | 2013 | 2014 | 2015 | 2016 | 2017 | 2018 | 2019 | 2020 | 2021 | 2022 | |
| Crook County | 87,000 | 127,113 | 132,450 | 157,750 | 188,000 | 205,000 | 250,450 | 250,000 | 257,000 | 372,000 | 390,000 |
| Bend | 220,395 | 269,000 | 289,950 | 327,487 | 360,000 | 389,950 | 407,000 | 432,000 | 440,000 | 580,000 | 683,000 |
| Redmond | 132,000 | 175,000 | 196,275 | 223,266 | 255,000 | 280,000 | 278,900 | 300,000 | 325,000 | 377,000 | 500,000 |
| La Pine | 94,900 | 133,000 | 149,900 | 185,000 | 197,250 | 226,000 | 259,000 | 270,000 | 234,000 | 315,000 | 452,000 |
| Sisters | 245,000 | 300,000 | 269,078 | 330,000 | 372,000 | 379,000 | 376,030 | 450,000 | 430,000 | 479,000 | 667,000 |
| Sunriver | 347,500 | 364,000 | 367,500 | 375,000 | 390,500 | 485,000 | 402,500 | 475,000 | 500,000 | 784,000 | 885,000 |
| Jefferson County | 72,500 | 85,000 | 111,000 | 121,000 | 140,000 | 164,000 | 195,000 | 224,000 | 228,000 | 277,000 | 356,000 |
| U.S. | 180,200 | 197,100 | 208,300 | 222,400 | 244,800 | 245,600 | 309,700 | 329,700 | 320,000 | 357,100 | 392,600 |
| Sources: Beacon Report (Jan. 2023), National Association of Realtors (Jan. 2023) | |||||||||||
Average Monthly Rent
As in-migration to Central Oregon continues, demand for rental housing outstrips supply. This exerts pressure on prices and generates a growing interest in multi-family residential construction, particularly in Redmond. Over the past twelve months rents increased 1.6%, the average apartment is estimated at $1,470/month, below the $1,700/month metro-wide average. Although prices today are 40.4% higher than they were a decade ago, renters can find apartments at a lower rate compared to some in the Bend area, according to Compass Commercial. until supply increases, expect the rental market to be persistently tight.
.png)
| Sources: Compass Commercial Multi-Family Submarket Report (2023) |